
We are going to predicting crime rate in chicago with Facebook Prophet.
Our dataset contains a summary of the reported crimes occurred in the City of Chicago from 2001 to 2017 and contains the following columns:
- ID: Unique identifier for the record.
- Case Number: The Chicago Police Department RD Number (Records Division Number), which is unique to the incident.
- Date: Date when the incident occurred.
- Block: address where the incident occurred
- IUCR: The Illinois Unifrom Crime Reporting code.
- Primary Type: The primary description of the IUCR code.
- Description: The secondary description of the IUCR code, a subcategory of the primary description.
- Location Description: Description of the location where the incident occurred.
- Arrest: Indicates whether an arrest was made.
- Domestic: Indicates whether the incident was domestic-related as defined by the Illinois Domestic Violence Act.
- Beat: Indicates the beat where the incident occurred. A beat is the smallest police geographic area – each beat has a dedicated police beat car.
- District: Indicates the police district where the incident occurred.
- Ward: The ward (City Council district) where the incident occurred.
- Community Area: Indicates the community area where the incident occurred. Chicago has 77 community areas.
- FBI Code: Indicates the crime classification as outlined in the FBI’s National Incident-Based Reporting System (NIBRS).
- X Coordinate: The x coordinate of the location where the incident occurred in State Plane Illinois East NAD 1983 projection.
- Y Coordinate: The y coordinate of the location where the incident occurred in State Plane Illinois East NAD 1983 projection.
- Year: Year the incident occurred.
- Updated On: Date and time the record was last updated.
- Latitude: The latitude of the location where the incident occurred. This location is shifted from the actual location for partial redaction but falls on the same block.
- Longitude: The longitude of the location where the incident occurred. This location is shifted from the actual location for partial redaction but falls on the same block.
- Location: The location where the incident occurred in a format that allows for creation of maps and other geographic operations on this data portal. This location is shifted from the actual location for partial redaction but falls on the same block.
Data source: https://www.kaggle.com/currie32/crimes-in-chicago
Prophet
Prophet is open source software released by Facebook’s Core Data Science team.
Prophet is a procedure for forecasting time series data based on an additive model where non-linear trends are fit with yearly, weekly, and daily seasonality, plus holiday effects. It works best with time series that have strong seasonal effects and several seasons of historical data.
In this link you have more information about Prophet with Python:
- https://research.fb.com/prophet-forecasting-at-scale/
- https://facebook.github.io/prophet/docs/quick_start.html#python-api
1 – Import libraries and dataset
import pandas as pd
import numpy as np
import matplotlib.pyplot as plt
import random
import seaborn as sns
from fbprophet import Prophet
df_1 = pd.read_csv('Chicago_Crimes_2001_to_2004.csv', error_bad_lines=False)
df_2 = pd.read_csv('Chicago_Crimes_2005_to_2007.csv', error_bad_lines=False)
df_3 = pd.read_csv('Chicago_Crimes_2008_to_2011.csv', error_bad_lines=False)
df_4 = pd.read_csv('Chicago_Crimes_2012_to_2017.csv', error_bad_lines=False)
# Concatenaning all datasets
df = pd.concat([df_1, df_2, df_3, df_4], ignore_index=False, axis=0)
df.head()
| Unnamed: 0 | ID | Case Number | Date | Block | IUCR | Primary Type | Description | Location Description | Arrest | ... | Ward | Community Area | FBI Code | X Coordinate | Y Coordinate | Year | Updated On | Latitude | Longitude | Location | |
|---|---|---|---|---|---|---|---|---|---|---|---|---|---|---|---|---|---|---|---|---|---|
| 0 | 879 | 4786321 | HM399414 | 01/01/2004 12:01:00 AM | 082XX S COLES AVE | 0840 | THEFT | FINANCIAL ID THEFT: OVER $300 | RESIDENCE | False | ... | 7.0 | 46.0 | 06 | NaN | NaN | 2004.0 | 08/17/2015 03:03:40 PM | NaN | NaN | NaN |
| 1 | 2544 | 4676906 | HM278933 | 03/01/2003 12:00:00 AM | 004XX W 42ND PL | 2825 | OTHER OFFENSE | HARASSMENT BY TELEPHONE | RESIDENCE | False | ... | 11.0 | 61.0 | 26 | 1173974.0 | 1876757.0 | 2003.0 | 04/15/2016 08:55:02 AM | 41.817229 | -87.637328 | (41.817229156, -87.637328162) |
| 2 | 2919 | 4789749 | HM402220 | 06/20/2004 11:00:00 AM | 025XX N KIMBALL AVE | 1752 | OFFENSE INVOLVING CHILDREN | AGG CRIM SEX ABUSE FAM MEMBER | RESIDENCE | False | ... | 35.0 | 22.0 | 20 | NaN | NaN | 2004.0 | 08/17/2015 03:03:40 PM | NaN | NaN | NaN |
| 3 | 2927 | 4789765 | HM402058 | 12/30/2004 08:00:00 PM | 045XX W MONTANA ST | 0840 | THEFT | FINANCIAL ID THEFT: OVER $300 | OTHER | False | ... | 31.0 | 20.0 | 06 | NaN | NaN | 2004.0 | 08/17/2015 03:03:40 PM | NaN | NaN | NaN |
| 4 | 3302 | 4677901 | HM275615 | 05/01/2003 01:00:00 AM | 111XX S NORMAL AVE | 0841 | THEFT | FINANCIAL ID THEFT:$300 &UNDER | RESIDENCE | False | ... | 34.0 | 49.0 | 06 | 1174948.0 | 1831051.0 | 2003.0 | 04/15/2016 08:55:02 AM | 41.691785 | -87.635116 | (41.691784636, -87.635115968) |
2 – Missing values
# Let's see how many null elements are contained in the data
total = df.isnull().sum().sort_values(ascending=False)
# missing values percentage
percent = ((df.isnull().sum())*100)/df.isnull().count().sort_values(ascending=False)
missing_data = pd.concat([total, percent], axis=1, keys=['Total','Percent'], sort=False).sort_values('Total', ascending=False)
missing_data.head(40)
| Total | Percent | |
|---|---|---|
| Community Area | 702091 | 8.841028 |
| Ward | 700224 | 8.817518 |
| Location | 105574 | 1.329433 |
| Longitude | 105574 | 1.329433 |
| Latitude | 105573 | 1.329420 |
| Y Coordinate | 105573 | 1.329420 |
| X Coordinate | 105573 | 1.329420 |
| Location Description | 1990 | 0.025059 |
| District | 91 | 0.001146 |
| Case Number | 7 | 0.000088 |
| Arrest | 0 | 0.000000 |
| Date | 0 | 0.000000 |
| Block | 0 | 0.000000 |
| IUCR | 0 | 0.000000 |
| Primary Type | 0 | 0.000000 |
| Description | 0 | 0.000000 |
| Year | 0 | 0.000000 |
| Domestic | 0 | 0.000000 |
| ID | 0 | 0.000000 |
| Unnamed: 0 | 0 | 0.000000 |
| FBI Code | 0 | 0.000000 |
| Updated On | 0 | 0.000000 |
| Beat | 0 | 0.000000 |
– Dropping unnamed:
df.drop(['Unnamed: 0', 'Case Number', 'IUCR', 'X Coordinate', 'Y Coordinate','Updated On','Year', 'FBI Code', 'Beat','Ward','Community Area', 'Location', 'District', 'Latitude' , 'Longitude'], inplace=True, axis=1)
df
| ID | Date | Block | Primary Type | Description | Location Description | Arrest | Domestic | |
|---|---|---|---|---|---|---|---|---|
| 0 | 4786321 | 01/01/2004 12:01:00 AM | 082XX S COLES AVE | THEFT | FINANCIAL ID THEFT: OVER $300 | RESIDENCE | False | False |
| 1 | 4676906 | 03/01/2003 12:00:00 AM | 004XX W 42ND PL | OTHER OFFENSE | HARASSMENT BY TELEPHONE | RESIDENCE | False | True |
| 2 | 4789749 | 06/20/2004 11:00:00 AM | 025XX N KIMBALL AVE | OFFENSE INVOLVING CHILDREN | AGG CRIM SEX ABUSE FAM MEMBER | RESIDENCE | False | False |
| 3 | 4789765 | 12/30/2004 08:00:00 PM | 045XX W MONTANA ST | THEFT | FINANCIAL ID THEFT: OVER $300 | OTHER | False | False |
| 4 | 4677901 | 05/01/2003 01:00:00 AM | 111XX S NORMAL AVE | THEFT | FINANCIAL ID THEFT:$300 &UNDER | RESIDENCE | False | False |
| ... | ... | ... | ... | ... | ... | ... | ... | ... |
| 1456709 | 10508679 | 05/03/2016 11:33:00 PM | 026XX W 23RD PL | BATTERY | DOMESTIC BATTERY SIMPLE | APARTMENT | True | True |
| 1456710 | 10508680 | 05/03/2016 11:30:00 PM | 073XX S HARVARD AVE | CRIMINAL DAMAGE | TO PROPERTY | APARTMENT | True | True |
| 1456711 | 10508681 | 05/03/2016 12:15:00 AM | 024XX W 63RD ST | BATTERY | AGGRAVATED: HANDGUN | SIDEWALK | False | False |
| 1456712 | 10508690 | 05/03/2016 09:07:00 PM | 082XX S EXCHANGE AVE | BATTERY | DOMESTIC BATTERY SIMPLE | SIDEWALK | False | True |
| 1456713 | 10508692 | 05/03/2016 11:38:00 PM | 001XX E 75TH ST | OTHER OFFENSE | OTHER WEAPONS VIOLATION | PARKING LOT/GARAGE(NON.RESID.) | True | False |
– Assembling a datetime:
df.Date = pd.to_datetime(df.Date, format='%m/%d/%Y %I:%M:%S %p')
df.head()
| ID | Date | Block | Primary Type | Description | Location Description | Arrest | Domestic | |
|---|---|---|---|---|---|---|---|---|
| 0 | 4786321 | 2004-01-01 00:01:00 | 082XX S COLES AVE | THEFT | FINANCIAL ID THEFT: OVER $300 | RESIDENCE | False | False |
| 1 | 4676906 | 2003-03-01 00:00:00 | 004XX W 42ND PL | OTHER OFFENSE | HARASSMENT BY TELEPHONE | RESIDENCE | False | True |
| 2 | 4789749 | 2004-06-20 11:00:00 | 025XX N KIMBALL AVE | OFFENSE INVOLVING CHILDREN | AGG CRIM SEX ABUSE FAM MEMBER | RESIDENCE | False | False |
| 3 | 4789765 | 2004-12-30 20:00:00 | 045XX W MONTANA ST | THEFT | FINANCIAL ID THEFT: OVER $300 | OTHER | False | False |
| 4 | 4677901 | 2003-05-01 01:00:00 | 111XX S NORMAL AVE | THEFT | FINANCIAL ID THEFT:$300 &UNDER | RESIDENCE | False | False |
– Change the index to the date:
df.index = pd.DatetimeIndex(df.Date)
df.head()
| ID | Date | Block | Primary Type | Description | Location Description | Arrest | Domestic | |
|---|---|---|---|---|---|---|---|---|
| Date | ||||||||
| 2004-01-01 00:01:00 | 4786321 | 2004-01-01 00:01:00 | 082XX S COLES AVE | THEFT | FINANCIAL ID THEFT: OVER $300 | RESIDENCE | False | False |
| 2003-03-01 00:00:00 | 4676906 | 2003-03-01 00:00:00 | 004XX W 42ND PL | OTHER OFFENSE | HARASSMENT BY TELEPHONE | RESIDENCE | False | True |
| 2004-06-20 11:00:00 | 4789749 | 2004-06-20 11:00:00 | 025XX N KIMBALL AVE | OFFENSE INVOLVING CHILDREN | AGG CRIM SEX ABUSE FAM MEMBER | RESIDENCE | False | False |
| 2004-12-30 20:00:00 | 4789765 | 2004-12-30 20:00:00 | 045XX W MONTANA ST | THEFT | FINANCIAL ID THEFT: OVER $300 | OTHER | False | False |
| 2003-05-01 01:00:00 | 4677901 | 2003-05-01 01:00:00 | 111XX S NORMAL AVE | THEFT | FINANCIAL ID THEFT:$300 &UNDER | RESIDENCE | False | False |
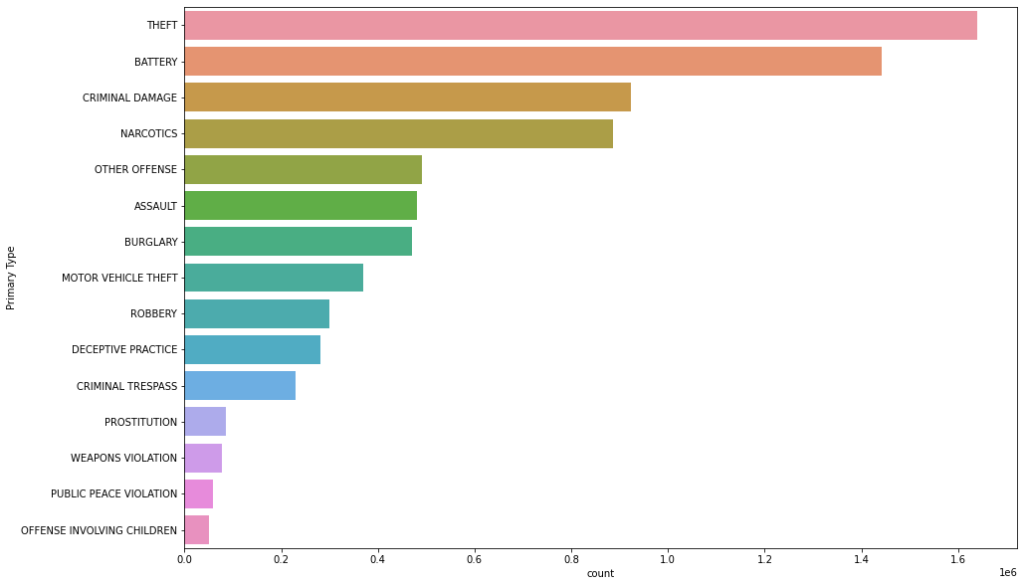
Primary Type visualization
df['Primary Type'].value_counts().iloc[:15]
    THEFT                         1640506
    BATTERY                       1442716
    CRIMINAL DAMAGE                923000
    NARCOTICS                      885431
    OTHER OFFENSE                  491922
    ASSAULT                        481661
    BURGLARY                       470958
    MOTOR VEHICLE THEFT            370548
    ROBBERY                        300453
    DECEPTIVE PRACTICE             280931
    CRIMINAL TRESPASS              229366
    PROSTITUTION                    86401
    WEAPONS VIOLATION               77429
    PUBLIC PEACE VIOLATION          58548
    OFFENSE INVOLVING CHILDREN      51441
    Name: Primary Type, dtype: int64
df['Primary Type'].value_counts().iloc[:15].index
    Index(['THEFT', 'BATTERY', 'CRIMINAL DAMAGE', 'NARCOTICS', 'OTHER OFFENSE',
           'ASSAULT', 'BURGLARY', 'MOTOR VEHICLE THEFT', 'ROBBERY',
           'DECEPTIVE PRACTICE', 'CRIMINAL TRESPASS', 'PROSTITUTION',
           'WEAPONS VIOLATION', 'PUBLIC PEACE VIOLATION',
           'OFFENSE INVOLVING CHILDREN'],
          dtype='object')
plt.figure(figsize = (15, 10))
sns.countplot(y= 'Primary Type', data = df, order = df['Primary Type'].value_counts().iloc[:15].index)
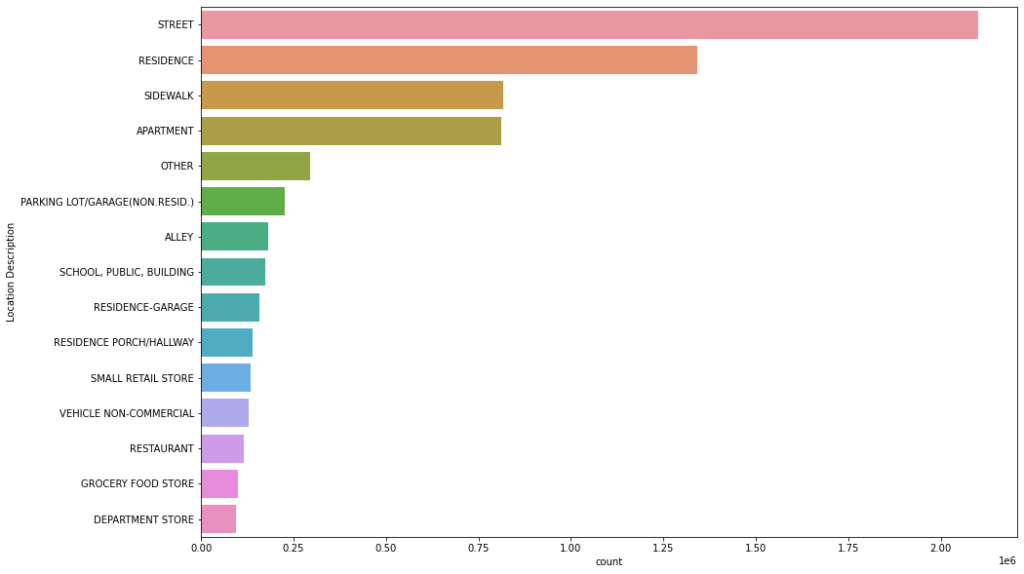
Location Description visualization
plt.figure(figsize = (15, 10))
sns.countplot(y= 'Location Description', data = df, order = df['Location Description'].value_counts().iloc[:15].index)
3 – Data resample
Resample is a Convenience method for frequency conversion and resampling of time series.
More info here: https://pandas.pydata.org/pandas-docs/stable/reference/api/pandas.Series.resample.html
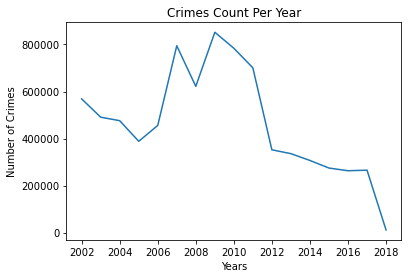
– Per year:
df.resample('Y').size()
    Date
    2001-12-31    568518
    2002-12-31    490879
    2003-12-31    475913
    2004-12-31    388205
    2005-12-31    455811
    2006-12-31    794684
    2007-12-31    621848
    2008-12-31    852053
    2009-12-31    783900
    2010-12-31    700691
    2011-12-31    352066
    2012-12-31    335670
    2013-12-31    306703
    2014-12-31    274527
    2015-12-31    262995
    2016-12-31    265462
    2017-12-31     11357
    Freq: A-DEC, dtype: int64
plt.plot(df.resample('Y').size())
plt.title('Crimes Count Per Year')
plt.xlabel('Years')
plt.ylabel('Number of Crimes')
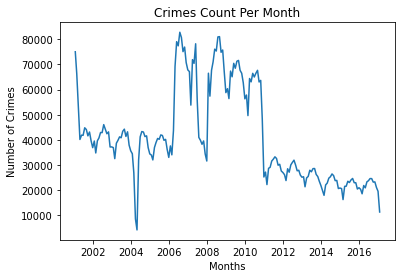
– Per month:
df.resample('M').size()
    Date
    2001-01-31    74995
    2001-02-28    66288
    2001-03-31    53122
    2001-04-30    40166
    2001-05-31    41876
                  ...
    2016-09-30    23235
    2016-10-31    23314
    2016-11-30    21140
    2016-12-31    19580
    2017-01-31    11357
    Freq: M, Length: 193, dtype: int64
plt.plot(df.resample('M').size())
plt.title('Crimes Count Per Month')
plt.xlabel('Months')
plt.ylabel('Number of Crimes')
5 – Data Preparation
df_prophet = df.resample('M').size().reset_index()
df_prophet
| Date | 0 | |
|---|---|---|
| 0 | 2001-01-31 | 74995 |
| 1 | 2001-02-28 | 66288 |
| 2 | 2001-03-31 | 53122 |
| 3 | 2001-04-30 | 40166 |
| 4 | 2001-05-31 | 41876 |
| ... | ... | ... |
| 188 | 2016-09-30 | 23235 |
| 189 | 2016-10-31 | 23314 |
| 190 | 2016-11-30 | 21140 |
| 191 | 2016-12-31 | 19580 |
| 192 | 2017-01-31 | 11357 |
df_prophet.columns = ['Date', 'Crime Count']
df_prophet.head()
| Date | Crime Count | |
|---|---|---|
| 0 | 2001-01-31 | 74995 |
| 1 | 2001-02-28 | 66288 |
| 2 | 2001-03-31 | 53122 |
| 3 | 2001-04-30 | 40166 |
| 4 | 2001-05-31 | 41876 |
df_prophet = pd.DataFrame(df_prophet)
df_prophet
| Date | Crime Count | |
|---|---|---|
| 0 | 2001-01-31 | 74995 |
| 1 | 2001-02-28 | 66288 |
| 2 | 2001-03-31 | 53122 |
| 3 | 2001-04-30 | 40166 |
| 4 | 2001-05-31 | 41876 |
| ... | ... | ... |
| 188 | 2016-09-30 | 23235 |
| 189 | 2016-10-31 | 23314 |
| 190 | 2016-11-30 | 21140 |
| 191 | 2016-12-31 | 19580 |
| 192 | 2017-01-31 | 11357 |
6 – Predictions with Prophet
df_prophet.columns
Index(['Date', 'Crime Count'], dtype='object')
df_prophet_final = df_prophet.rename(columns={'Date':'ds', 'Crime Count':'y'})
df_prophet_final.head()
| ds | y | |
|---|---|---|
| 0 | 2001-01-31 | 74995 |
| 1 | 2001-02-28 | 66288 |
| 2 | 2001-03-31 | 53122 |
| 3 | 2001-04-30 | 40166 |
| 4 | 2001-05-31 | 41876 |
m = Prophet()
m.fit(df_prophet_final)
# Forcasting into the future
future = m.make_future_dataframe(periods=365)
forecast = m.predict(future)

forecast
| ds | trend | yhat_lower | yhat_upper | trend_lower | trend_upper | additive_terms | additive_terms_lower | additive_terms_upper | yearly | yearly_lower | yearly_upper | multiplicative_terms | multiplicative_terms_lower | multiplicative_terms_upper | yhat | |
|---|---|---|---|---|---|---|---|---|---|---|---|---|---|---|---|---|
| 0 | 2001-01-31 | 40559.731540 | 23628.244005 | 54258.118231 | 40559.731540 | 40559.731540 | -1574.911817 | -1574.911817 | -1574.911817 | -1574.911817 | -1574.911817 | -1574.911817 | 0.0 | 0.0 | 0.0 | 38984.819723 |
| 1 | 2001-02-28 | 40707.006266 | 18547.567086 | 49988.578194 | 40707.006266 | 40707.006266 | -6454.662746 | -6454.662746 | -6454.662746 | -6454.662746 | -6454.662746 | -6454.662746 | 0.0 | 0.0 | 0.0 | 34252.343520 |
| 2 | 2001-03-31 | 40870.060427 | 21495.169543 | 55202.417261 | 40870.060427 | 40870.060427 | -2068.155039 | -2068.155039 | -2068.155039 | -2068.155039 | -2068.155039 | -2068.155039 | 0.0 | 0.0 | 0.0 | 38801.905388 |
| 3 | 2001-04-30 | 41027.854775 | 23281.051427 | 53789.296148 | 41027.854775 | 41027.854775 | -1473.221009 | -1473.221009 | -1473.221009 | -1473.221009 | -1473.221009 | -1473.221009 | 0.0 | 0.0 | 0.0 | 39554.633766 |
| 4 | 2001-05-31 | 41190.908936 | 29675.632094 | 61543.960585 | 41190.908936 | 41190.908936 | 3883.204571 | 3883.204571 | 3883.204571 | 3883.204571 | 3883.204571 | 3883.204571 | 0.0 | 0.0 | 0.0 | 45074.113507 |
| ... | ... | ... | ... | ... | ... | ... | ... | ... | ... | ... | ... | ... | ... | ... | ... | ... |
| 553 | 2018-01-27 | 9114.477200 | -11154.856735 | 21864.404720 | 8834.763543 | 9395.155285 | -3423.766249 | -3423.766249 | -3423.766249 | -3423.766249 | -3423.766249 | -3423.766249 | 0.0 | 0.0 | 0.0 | 5690.710951 |
| 554 | 2018-01-28 | 9100.488430 | -8934.453537 | 23419.424189 | 8819.513188 | 9382.545758 | -2770.269732 | -2770.269732 | -2770.269732 | -2770.269732 | -2770.269732 | -2770.269732 | 0.0 | 0.0 | 0.0 | 6330.218698 |
| 555 | 2018-01-29 | 9086.499659 | -8341.707573 | 22854.628784 | 8804.262834 | 9369.895953 | -2232.904204 | -2232.904204 | -2232.904204 | -2232.904204 | -2232.904204 | -2232.904204 | 0.0 | 0.0 | 0.0 | 6853.595455 |
| 556 | 2018-01-30 | 9072.510889 | -8308.241536 | 22550.218800 | 8789.291815 | 9357.246149 | -1837.148931 | -1837.148931 | -1837.148931 | -1837.148931 | -1837.148931 | -1837.148931 | 0.0 | 0.0 | 0.0 | 7235.361958 |
| 557 | 2018-01-31 | 9058.522118 | -9068.314852 | 22729.458262 | 8773.599845 | 9344.596345 | -1605.129458 | -1605.129458 | -1605.129458 | -1605.129458 | -1605.129458 | -1605.129458 | 0.0 | 0.0 | 0.0 | 7453.392660 |
figure = m.plot(forecast, xlabel='Date', ylabel='Crime Rate')
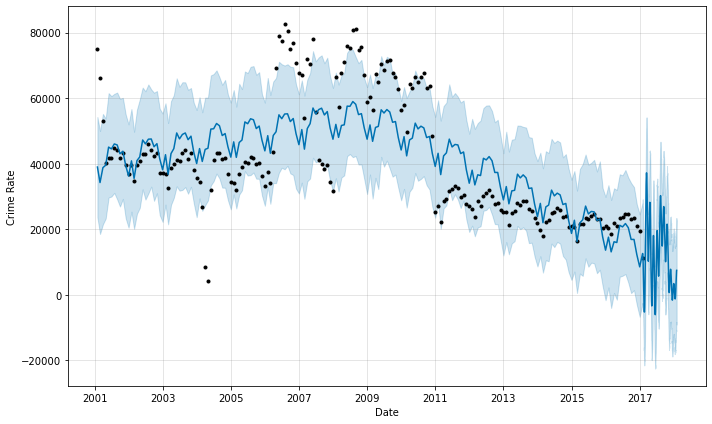
figure2 = m.plot_components(forecast)
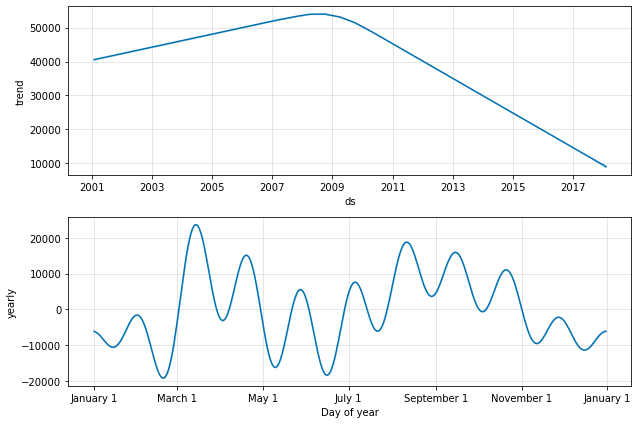
We can see the prediction with prophet is right and we could predict crime rate in Chicago for next years with some precision.